































On July 19, 2024, a faulty software update from CrowdStrike caused approximately 8.5 million Windows systems to crash simultaneously – grounding flights, halting hospitals and freezing financial transactions across the globe. The update had passed automated testing. No one saw the failure coming because no one had visibility into the full chain of dependencies the change would affect.
This is the defining challenge of modern IT: systems are deeply interconnected, failures cascade across layers and most monitoring setups only capture part of the picture. The SolarWinds 2026 State of Monitoring and Observability Report found that 77% of IT teams lack full visibility across on-premises and cloud environments. The same report found that 75% say lack of coordination between teams hinders effective observability and 55% report using too many monitoring tools simultaneously.
More tools. Less visibility. That is the blind spot problem in modern IT – and full stack observability is the architecture designed to solve it.
Join The European Business Briefing
New subscribers this quarter are entered into a draw to win a Rolex Submariner. Join 40,000+ founders, investors and executives who read EBM every day.
SubscribeWhy Blind Spots Exist in the First Place
The root cause of most IT performance blind spots is not a lack of data. It is the fragmentation of data across teams, tools and infrastructure layers that prevents a coherent picture from forming.
The rise of microservices, serverless and cloud-native architectures has made this fragmentation structurally worse. Logs, metrics and traces come from a multitude of sources and must be connected to gain actionable insights serverless functionality creates ever-changing operating environments where traditional monitoring is insufficient.
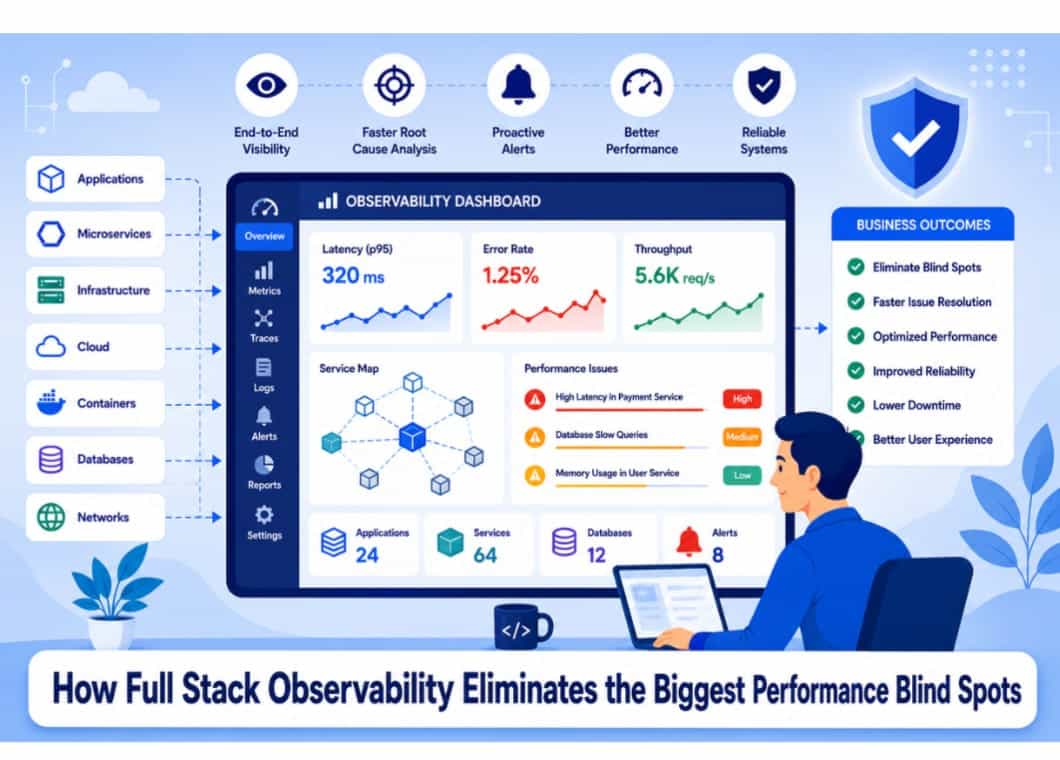
The result is that when an incident occurs, engineering teams spend more time reconstructing what happened across scattered data sources than they spend actually resolving the problem. Full stack observability addresses this by unifying telemetry across every layer — application, infrastructure, database, network, user experience and security — into a single correlated view that engineers can actually interrogate during an incident.
The 6 Biggest Performance Blind Spots Full Stack Observability Eliminates
Every environment has its own specific gaps, but the same categories of blind spots appear repeatedly across distributed, cloud-native IT environments. These are the six that cause the most incident response delays and the hardest-to-diagnose performance degradation.
The blind spots below do not always surface as outages — many manifest as slow, unexplained degradation that erodes user experience gradually until it becomes a crisis.
1. Service Dependencies
In microservices architectures, a single user request can traverse dozens of services before returning a response. Without distributed tracing, a latency spike or failure anywhere in that chain is invisible to application-layer monitoring. When something goes wrong, pinpointing the root cause across dozens or hundreds of services is impossible with traditional monitoring — full stack observability provides the correlated telemetry to follow the path of a failing request and find the source of the problem.
2. Cloud Layer Gaps
Managed cloud services, serverless functions and multi-cloud deployments introduce infrastructure components that traditional on-premises monitoring tools cannot reach. An AWS Lambda throttle, an Azure SQL timeout or a GCP network anomaly will not appear in an infrastructure dashboard that only watches on-premises servers.
3. Database Bottlenecks
Slow queries, connection pool exhaustion and lock contention are among the most common causes of application performance degradation — and among the least visible to teams monitoring only at the application layer. Database-level telemetry, integrated into the full observability stack, surfaces these issues before they cascade into user-facing failures.
4. User Experience
Backend metrics showing healthy response times can coexist with a degraded user experience caused by frontend rendering issues, CDN latency or client-side JavaScript failures. Without real-user monitoring feeding into the same observability platform, performance is being measured from the infrastructure inward rather than from the user outward.
5. Siloed Team Data
A large section of IT teams say cross-team coordination failures directly hinder observability effectiveness. Network teams, infrastructure teams, application teams and database teams each hold partial telemetry. Without a shared observability layer that correlates their data, incident investigation becomes a manual process of chasing data across four different tools.
6. Security Events
Anomalous behaviour, unusual access patterns and lateral movement often appear first as performance anomalies — a sudden spike in database read volume, an unexpected network connection, a service calling an endpoint it has never called before. When security telemetry sits outside the observability stack, these signals go unnoticed until they escalate into incidents.
For a broader foundation on what full stack observability covers and how companies are implementing it, CyberNX’s Full Stack Observability Guide for Modern Enterprises provides a detailed breakdown of the architecture, signal types and implementation approach.
How Full Stack Observability Closes These Gaps
Full stack observability eliminates blind spots through three structural changes to how telemetry is collected, correlated and acted on.
Unified data collection: Rather than separate agents and tools for each layer, a full stack observability platform ingests logs, metrics and traces from every component through a common collection layer. This eliminates the data silos that make cross-layer correlation impossible.
Correlated context: When an incident fires, engineers see not just the alert but the full context — what service triggered it, which upstream dependencies contributed, what infrastructure metrics changed in the preceding minutes and what the user impact looks like in real time. This context compression is what reduces MTTR from hours to minutes.
Shared visibility across teams: A single observability platform used by network, infrastructure, application and database teams simultaneously eliminates the coordination delays that is the primary obstacle to effective incident response. Everyone is looking at the same data at the same time.
Conclusion
Performance blind spots in modern IT are not a symptom of poor engineering — they are an architectural consequence of distributed, multi-cloud environments that have outgrown the monitoring tools built for simpler times. Full stack observability resolves this by treating the entire technology stack as a single observable system rather than a collection of separately monitored components.
CyberNX’s full stack observability solutions help organisations unify logs, metrics, traces and user experience data into a coherent observability platform — eliminating the blind spots that slow incident response and erode system performance. If your organisation is experiencing unexplained degradation, extended MTTR or cross-team visibility gaps, connect with our observability experts today.