
































You can audit every SKU and drown in spreadsheets, or zero in on where the cost leaks most. A practical packaging-cost audit across a multi-SKU catalogue scans the entire list for outliers, then physically times and measures just ten high-volume SKUs and checks what share of annual shipments they really cover. You’ll know real cube, labour seconds, and billable weight, and you’ll have evidence ready for Regulation (EU) 2025/40, applicable since 12 August 2026. Rank, measure, model, pilot, expand: five steps, one repeatable rhythm.
Define which packaging levels are in scope
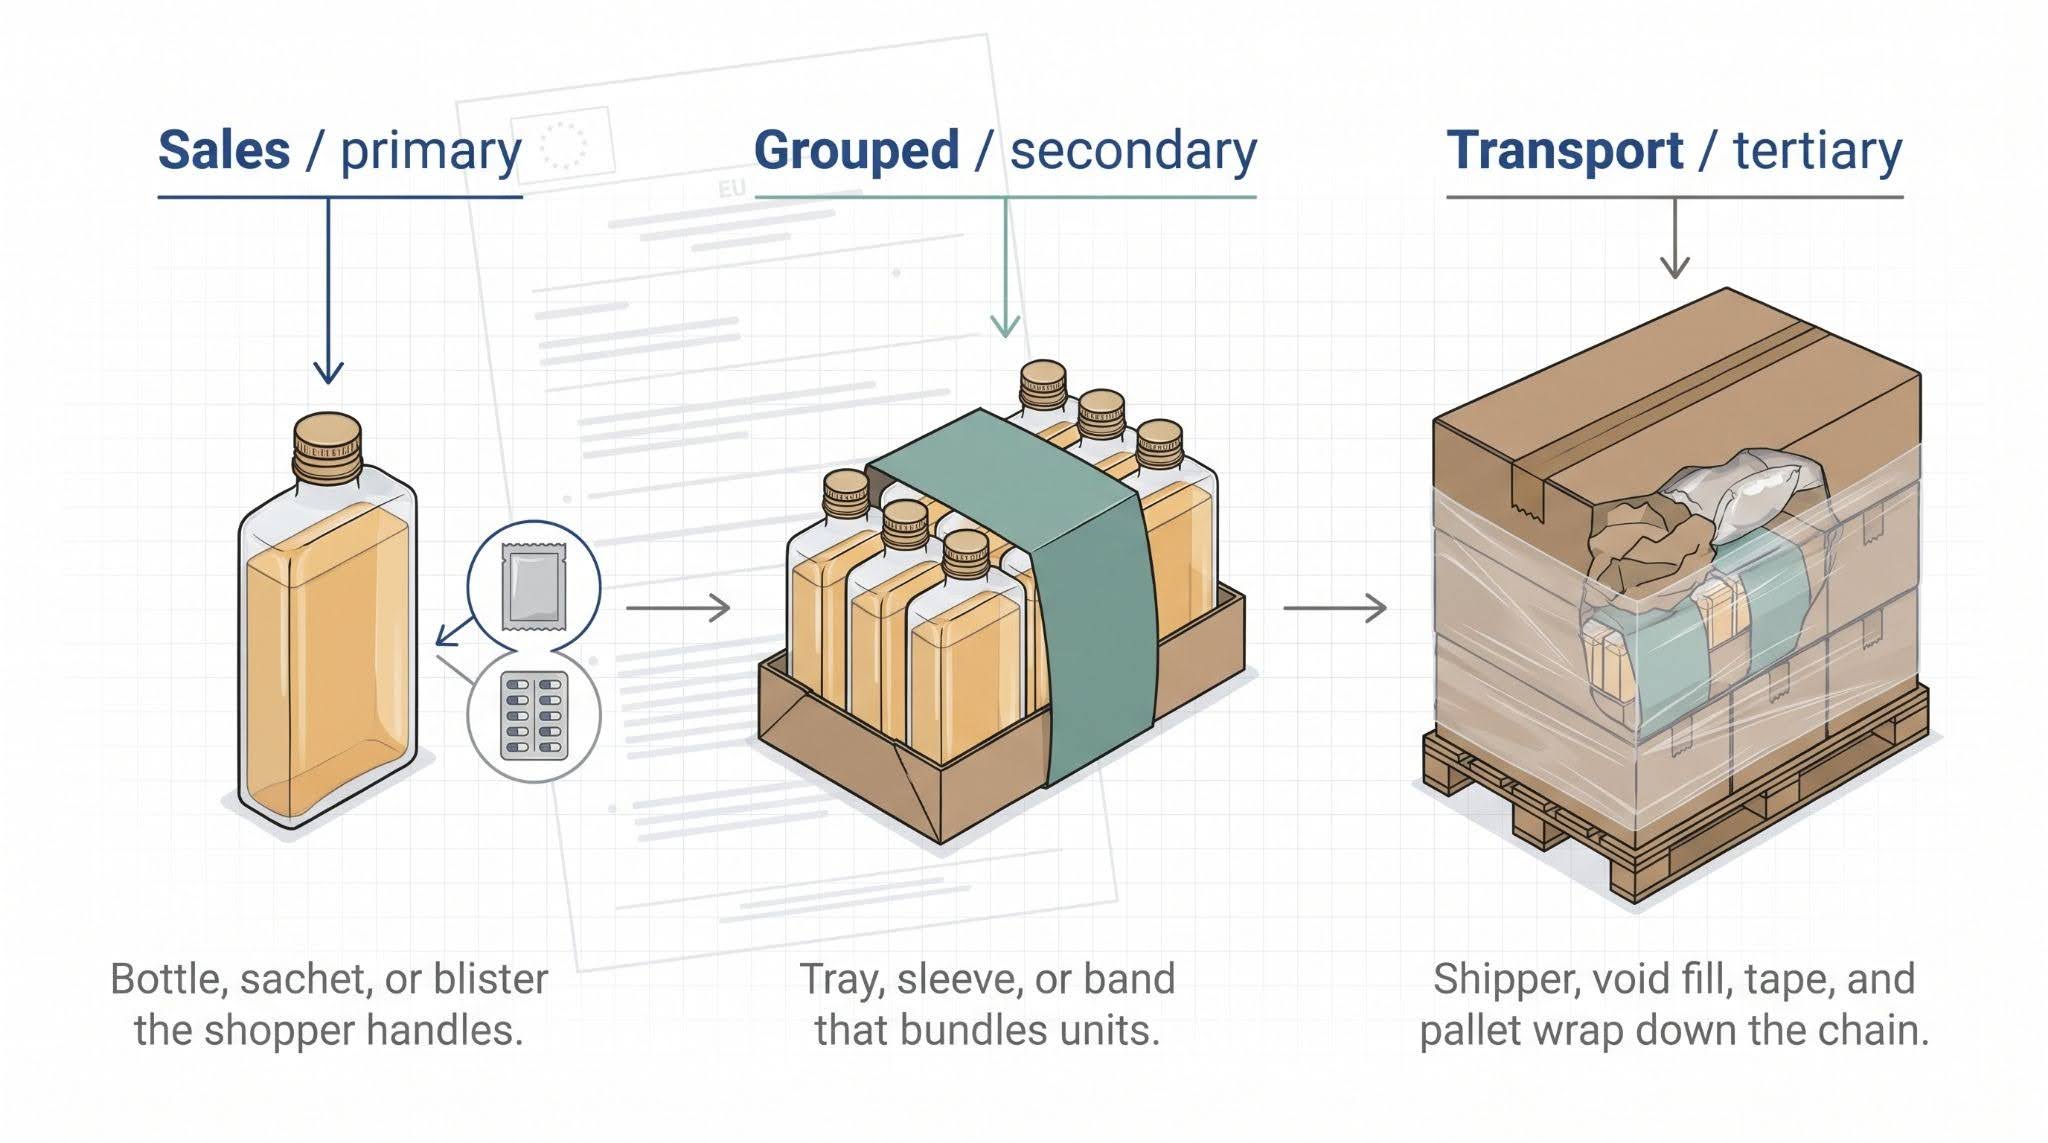
EU rules spell out three clear levels of packaging, and your team should use the same terms set by Regulation (EU) 2025/40:
Join The European Business Briefing
New subscribers this quarter are entered into a draw to win a Rolex Submariner. Join 40,000+ founders, investors and executives who read EBM every day.
Subscribe- Sales / primary: the bottle, sachet, or blister the shopper handles
- Grouped / secondary: the tray, sleeve, or band that bundles units
- Transport / tertiary: the shipper, void fill, tape, and pallet wrap that move goods down the chain
Locking scope here keeps Finance, Quality, and Regulatory on the same page, and it prevents your spreadsheet from swelling into a master-data project before the audit even starts.
Define the business boundary
Align on the outer fence before you open any spreadsheets. Three filters cover most cases:
- Where does the audit apply? Limit the first pass to EU fulfilment centres, or widen it to include the UK and GCC only when those markets share the same carriers and rate cards.
- What movement are we counting? Outbound e-commerce parcels, retail-ready trays, or both.
- When is the window? A rolling twelve-month view captures one full cycle of peak and slack periods; analysts favour it because, as Scout’s CPG glossary puts it, “A full trailing year always contains exactly one of every season.”
Capture the decision in one sentence and pin it to every brief:
“Audit outbound transport packaging for all EU parcel shipments from Venlo and Barcelona for the last full fiscal year.”
Now every data pull, meeting, and cost model lands on the same line in the sand.
Define the intended output
Write the finish line before you start, because a lack of clear goals was the most common factor (37 percent) behind project failure in the Project Management Institute’s 2017 Pulse of the Profession.
We commit to three tangible files, each due within 30 days of kickoff:
- Reconciled cost baseline: one spreadsheet that shows today’s all-in cost per shipped order, signed off by Finance.
- Ranked opportunity register: a living list that sizes each saving, states confidence, and names the data still missing.
- Pilot dossier for ten SKUs: photos, verified dimensions, carrier invoices, and a one-page P&L summary any CFO can scan in a meeting queue.
With the end state this explicit, stakeholders approve faster, data owners know exactly what to pull, and scope creep has nowhere to hide.
Rank by shipment volume, not only revenue
Warehouse work follows the 80/20 pattern: about 20 percent of SKUs generate 80 percent of all picks and touches, while many high-value items barely move on the line. Treat that as a rule of thumb, not a measurement, and start with picks, cartons closed, or parcels shipped, the metrics that burn labour, tape, and freight every day.
Practitioners land on the same small cohort. In an r/shopify_growth thread on shipping costs, one commenter’s advice was blunt: “Audit your top 10 SKUs by volume and right-size the packaging first.” Another replied that “Packaging changes often move the needle more than carrier discounts.”
Zenpack’s unified packaging system for multi-SKU catalogs starts in the same place: audit the top 10 best-selling SKUs to standardise outer shipper dielines, then map overlapping product dimensions into universal master cartons.
T3 Micro, a Zenpack client that moved to universal master cartons, says the change “reduced the packaging cost by 20%.”
Overlay order profiles
Shipment count tells only half the story. Two SKUs may each ship 10,000 times a year, yet they can travel in very different baskets.
Ask two questions of last year’s order lines:
- How often is the SKU the only item in the parcel? A high solo-ship rate makes that product solely accountable for cube, damage, and billed weight.
- Which SKUs ride together when it isn’t alone? Recurring bundles often dictate carton choice and void-fill usage more than any single item.
Track those patterns now so the later carton tests stay honest. Your model will reflect the mixed orders packers see on every shift.
Record coverage: don’t assume an 80 percent rule
After ranking and basket-mapping, total what the top-ten SKUs really touch:
-
- Parcels shipped
- Kilograms of packaging material
- Outbound freight spend
- Packaging cost on the P&L
A common rule of thumb says 20 percent of SKUs account for 80 percent of shipping cost, but ten SKUs in a large catalogue may cover far less. If your ten-SKU cohort covers about 80 percent of shipments or spend, the pilot can move the needle; if it lands nearer 40 percent, plan a second cohort. Record the numbers now so no one claims the audit “missed half the business.”
Maintain a narrow exception register
Some SKUs will never fit your high-volume pilot: the glass carafe, the UN 3481 lithium-ion kit subject to dangerous-goods rules, or the gift set that ships twice a year yet leaks when mishandled.
Park these edge cases in a tight exception register, noting the hazard (fragile, hazardous, temperature-controlled, retailer mandate), the evidence still missing, and the shipment share they represent. Keep the list under 5 percent of annual parcels so it cannot derail the pilot. Circle back once the top-ten work is complete; until then, the long tail stays in its lane.
State when cohort two opens
Write the gate into the charter before you weigh the first sample:
“Open cohort two only when the pilot (a) covers less than 80 percent of annual freight spend, (b) uncovers a supplier-price error that affects more than ten SKUs, or (c) leaves an entire packaging family untested.”
Track these metrics weekly during the four-week pilot. If none trip the threshold, finish the first cohort, lock in the savings, and revisit expansion during the next quarterly review.
Pull catalogue and shipment data
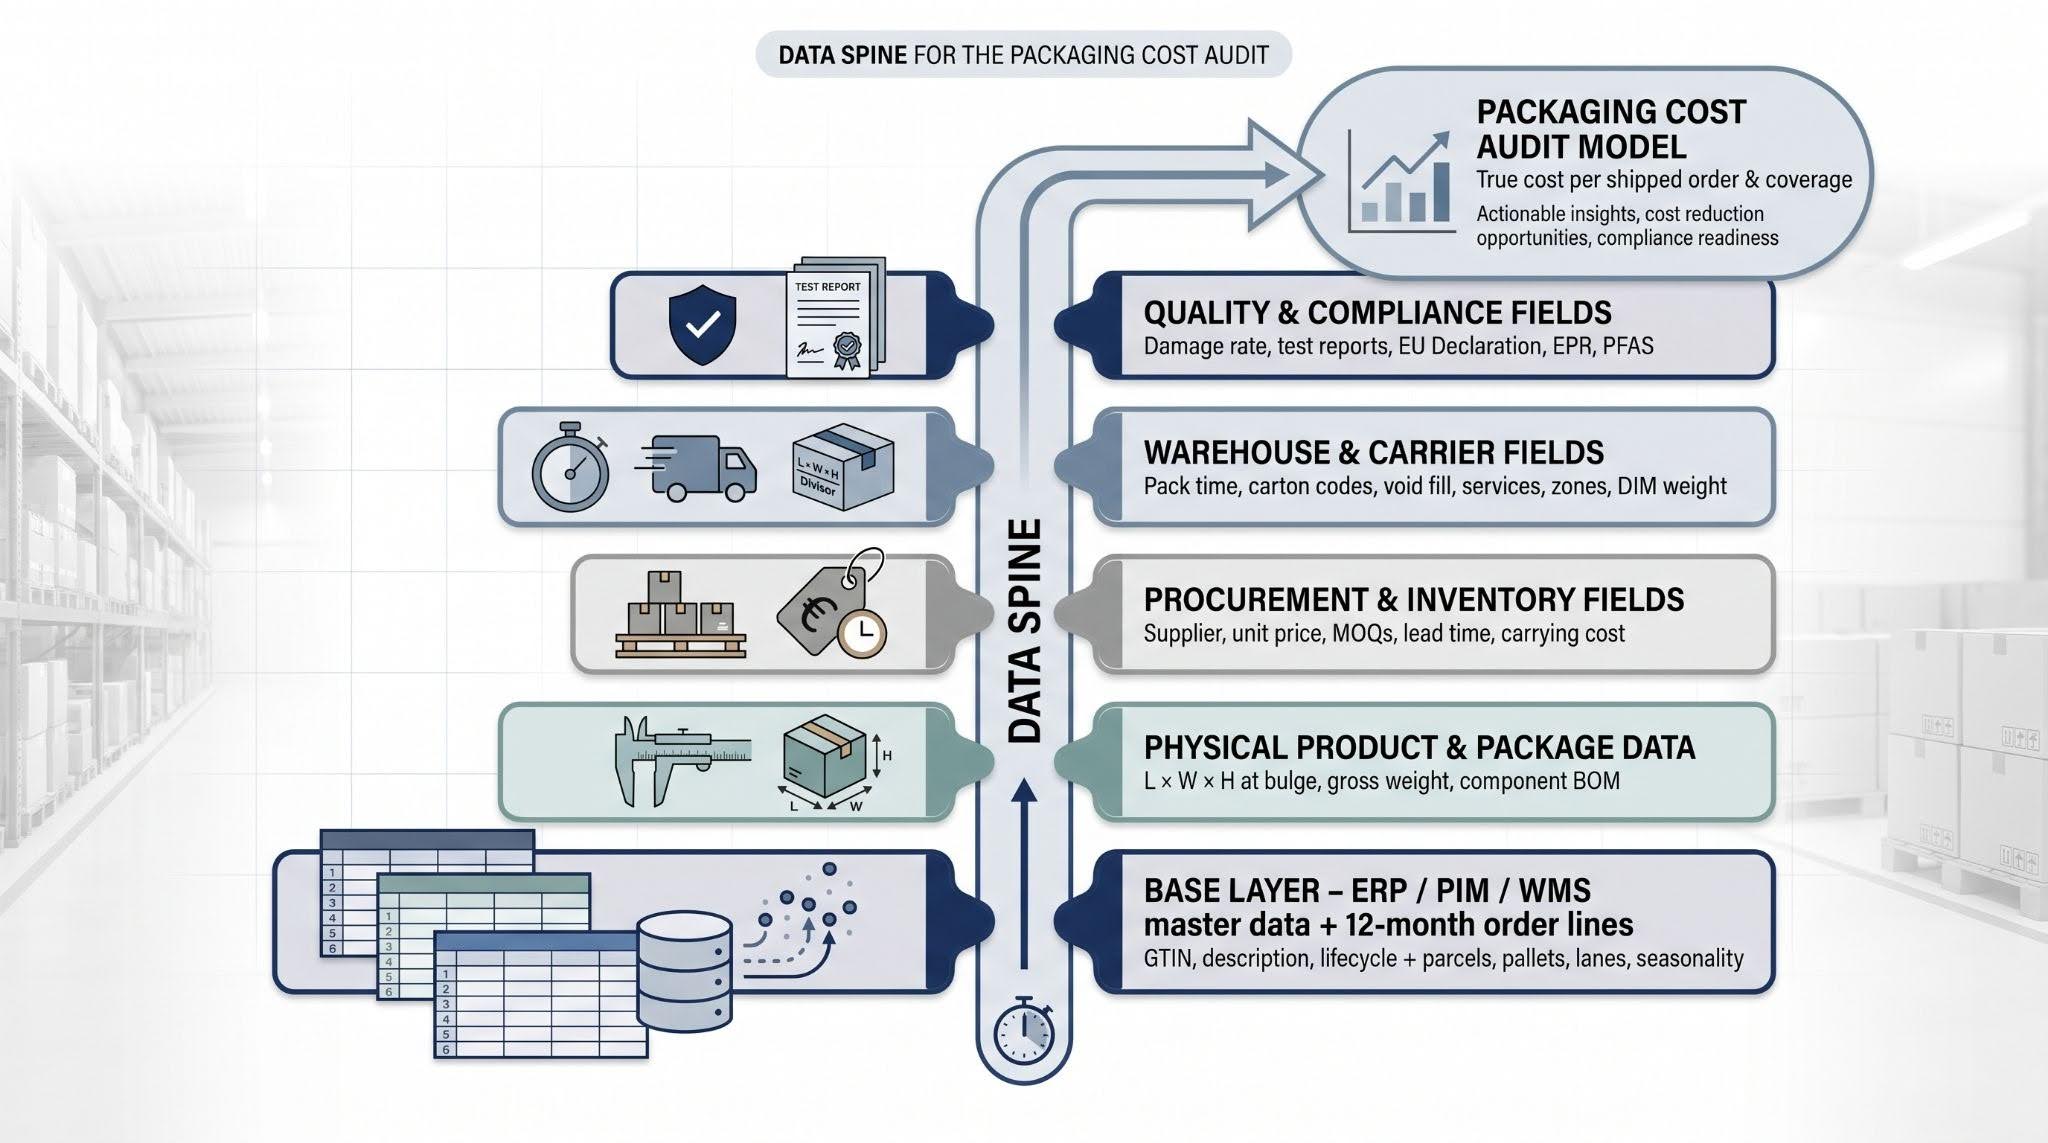
Start where the truth already lives. Extract from ERP, PIM, and WMS the master data for each trade item: GTIN, description, hierarchy level, launch date, and lifecycle status. Next, link each SKU to a rolling twelve-month order-line file that lists parcels shipped, pallets built, lanes, and seasonality.
Why keep the history? Without time stamps you cannot see the spike that forced an urgent box reorder or the lull that left inserts aging on the shelf. The merged sheet becomes the spine of the audit; every later cube, labour, or freight calculation hangs on these dates and quantities.
Add physical product and package data
Step away from the screen and pick up the calipers. Follow the GS1 Package & Product Measurement Standard so every future audit speaks the same language. For each finished pack, record:
- External L × W × H at the bulge, tape, and crushed corners
- Gross weight (product plus pack) to the nearest gram
- Component bill of material: tray, insert, label, and dunnage, with material, grade, and grams
These fields do more than populate a cost sheet. They settle carrier-invoice disputes, power dimensional-weight models, and prove compliance when a regulator knocks. Accurate, traceable measurements turn packaging from folklore into data and keep every later calculation honest.
Add procurement and inventory fields
Cost becomes real only when euros attach to grams. For every packaging component, log:
-
- Supplier name and Incoterm
- Unit price and price-break ladder
- Minimum order quantity (MOQ) and lead time
- One-off charges such as dies, print plates, and artwork
- Average stock on hand (days), and annual write-offs
According to NetSuite, inventory carrying costs often comprise 20 to 30 percent of total inventory value each year. Seeing that hidden tax turns “buy a truckload for the discount” into “order monthly and free the cash.”
Add warehouse and carrier fields
Connect the shop floor to the invoice.
- Pack time and changeovers: seconds per parcel from time-study or pick-to-manifest reports
- Carton code suggested vs. chosen: WMS recommendation compared with what operators actually select
- Void-fill grams per order
- Carrier service, zone, and surcharges
- Actual weight vs. chargeable weight: length × width × height ÷ divisor (DHL’s standard divisor is 5,000 for kg and cm; many parcel contracts vary)
When your spreadsheet shows a 200-g item billed at 1.4 kg, you know exactly where to run right-size tests and how many labour seconds a better box could save.
Add quality and compliance fields
Cost savings mean little if you face breakage, recalls, or paperwork fines, so log compliance next to cost:
- Damage rate (claims per 1,000 units), and primary return reasons
- Carrier claims: value and outcome
- Current test reports: date and protocol (for example, ISTA 3A)
- EU Declaration of Conformity and technical file status: held? Y/N, last review date
- Retention clock: the retention period PPWR sets for both documents, checked for single-use and reusable packs
- EPR market and fee code for each destination country
- PFAS statement and substance evidence owner
Tag every line with the person responsible for updates. When an inspector calls, you will have the document, the date, and the name, with no audit scramble and no stop-ship surprise.
Verify the master data physically
Your models die on bad millimetres. Pull a random 10-item sample of each pilot SKU from live stock and measure it under the GS1 Package & Product Measurement Standard. Record:
-
- Sealed L × W × H at the bulge
- Gross weight to the nearest gram
- Photo with date-stamp, and carton revision code
If the warehouse reading differs from ERP by more than plus or minus 3 mm or 1 percent, flag the field and update the system of record before running freight or DIM models. One afternoon of calibrated checks prevents months of invoice disputes later.
Calculate the true cost per shipped order
One sheet, six cost buckets. Capture each in euros per shipped order, then model the year.
| Bucket | How to calculate | Why it matters |
| Packaging materials | Σ(component grams × unit price) + scrap percent | Reveals quiet drift toward heavier cartons or promo sleeves |
| Packing labour | Time-study seconds × blended labour €/sec | A 10-second insert costs about 2,000 hours on 750,000 orders |
| Outbound freight | Chargeable weight = max(actual, (L × W × H / 5,000)*) | Volumetric weight, not scale weight, can set the bill |
| Damage / failure | (Refund + reship + disposal + service minutes) ÷ orders | Turns protection into cents per order, not a vague “rate” |
| Inventory carry | Avg. stock € × carry percent × days on hand ÷ 365 | Shows cash tied up in slow-moving inserts |
| Tooling & compliance | (Dies + plates + tests + system time) ÷ life (years) | Avoids saving €0.05 and spending €0.20 on re-qualification |
*DHL’s standard volumetric divisor of 5,000 for dimensions in cm and weight in kg.
Model net annual value
Run conservative, expected, and upside cases:
Net € = (Current €/order minus Proposed €/order) × Forecast orders, minus Annualised one-offs.
If the expected case beats your hurdle rate, green-light the pilot. If not, adjust the design or walk away; let the math decide, not opinion.
Run the physical audit on the warehouse floor
Inspect the package as shipped
Work where the tape seals. Pull a random sample of ten finished parcels per SKU straight off the conveyor and measure them with a calibrated steel rule, following the GS1 Package & Product Measurement Standard. On a flat surface:
- Record length × width × height at the widest bulge, including tape seams and crushed corners.
- Weigh each parcel to the nearest gram.
- Photograph three sides plus the shipping label, and capture the carton revision code.
- File the measurements, photos, and operator initials in the audit folder.
Flag any dimension that drifts more than ±3 mm or ±1 percent from master data before you run freight or DIM models.
Pilot, then expand
Take the highest-confidence item from the opportunity register into a pilot, and write the acceptance criteria before the test: product protection, pack time, and chargeable weight against the baseline. Compare the baseline and pilot periods, then decide. “No change” is an allowed result. Open a second cohort only when one of the gates above trips; otherwise lock in the savings and revisit expansion at the next quarterly review.